Smart Narratives in Power BI
Power BI and the Microsoft team has released a new feature in public preview called smart narratives. This addition to Power BI is amazing and provides some versatility. Let’s talk about this feature for a moment.
What is smart narratives in Power BI. Smart narratives as of the date of writing this blog provides two views. A narrative synopses of a specific data point element on your report and a holistic report or page narrative. An easy way to explain it is a smart narrative is Power BI’s way of developing a story line about your data.
How do you use it and how does it work? As of today smart narratives is a public preview feature. So step one is to update your Power BI desktop version. So head on over to PowerBI.com and download the latest version of Power BI desktop. Once you have done that; navigate and enable the preview feature of smart narratives.
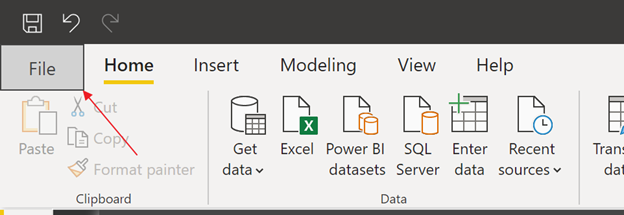
File:
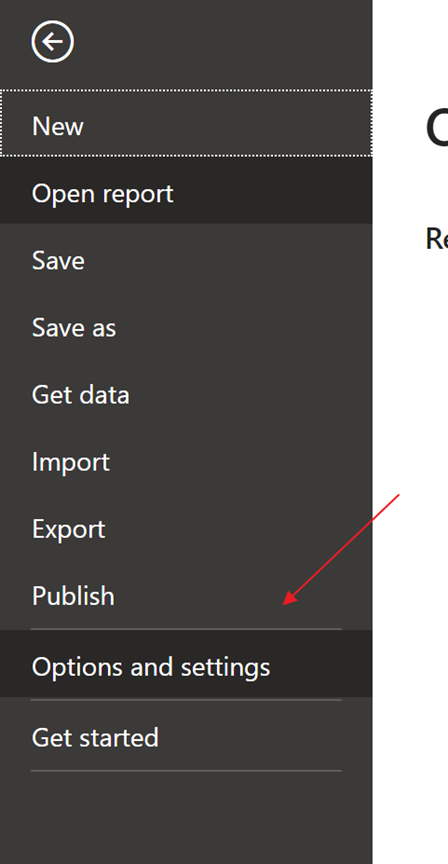
Options and Settings:
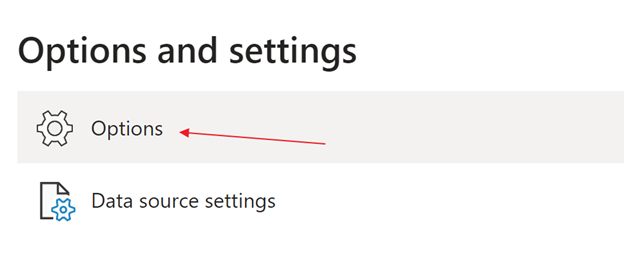
Options:
Preview Features and enable Smart Narratives:
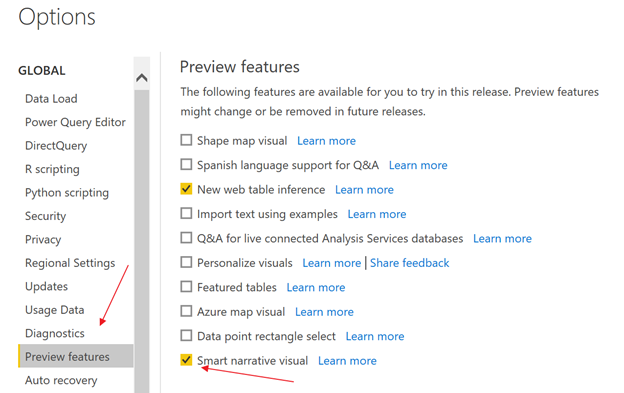
Once you do this and save your changes. Power BI will prompt you to restart Power BI to start using this feature. When you restart Power BI you will now have a new icon in the visualization blade to the right that looks like a word document.
OK now that you have the new visualization it is time to understand how to use it. It’s really simple. If you want to let Power BI tell the narrative or story about your entire page just drag the visual on to the page where you want it and let the power of Power BI do the work. Let’s see what that looks like.
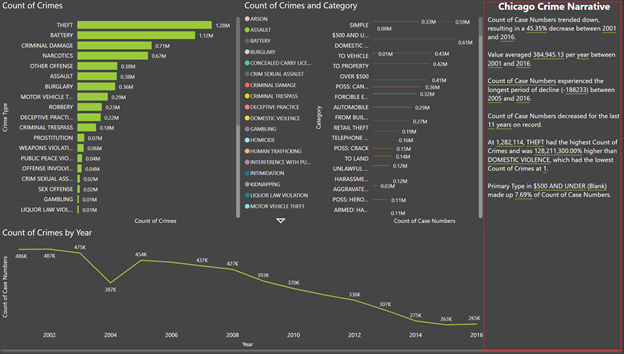
My dataset represents crime activity in the city of Chicago and is a public data source which I cannot validate the accuracy of the data. So once I dragged the visual over to my canvas Power BI crunched the number of all my visuals and came up with:
————-
Count of Case Numbers trended down, resulting in a 45.35% decrease between 2001 and 2016. Value averaged 384,945.13 per year between 2001 and 2016.
Count of Case Numbers experienced the longest period of decline (-188233) between 2005 and 2016.
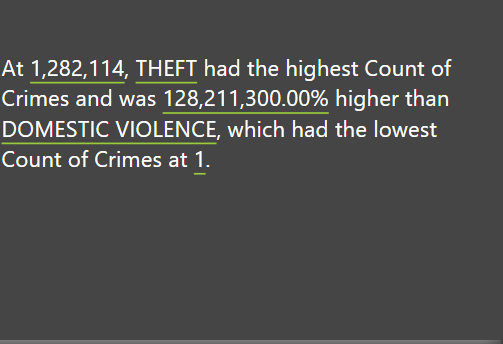
Count of Case Numbers decreased for the last 11 years on record. At 1,282,114, THEFT had the highest Count of Crimes and was 128,211,300.00% higher than DOMESTIC VIOLENCE, which had the lowest Count of Crimes at 1. Primary Type in $500 AND UNDER made up 7.69% of Count of Case Numbers.
————-
What’s nice about this is you have the ability to add your own narrative or story to this and the flexibility to change the underlined data points that are pulled over.
So what about a single data point. Let’s see how easy it is to handle this as well. Instead of dragging the visual icon in let’s highlight a data point:
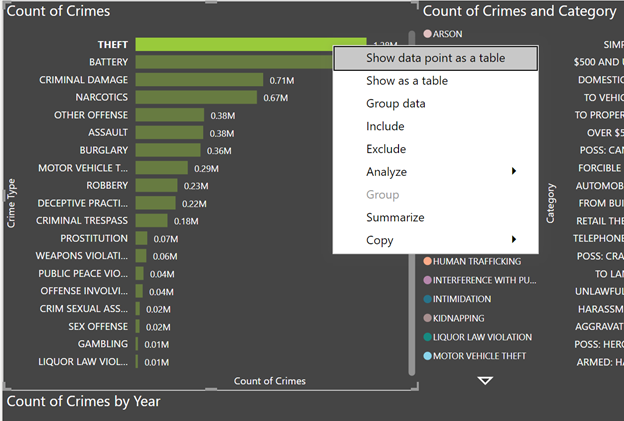
Now click summarize and let the magic begin!
Power BI has really stepped it up with this new visual and makes it easier for professional like me to really sell the ease and benefits of Power BI compared to a lot of other self-service analytics tools. I look forward to seeing what Power BI does next.