Data Profiling and Cleansing Part 1
Azure Synapse with Azure Data Catalog
Data analytics is a broad term but the foundational concepts of extraction, transformation and loading (ETL) OR extraction, loading and then transforming (ELT) are developmental practices that we will touch. A common issue that we all run into is what we call “dirty data”. In this two-part series I will walk you through techniques and tools that I use today to analyze my data before I build visualizations and present it to my targeted audience.
What is Dirty Data?
Dirty data is also known as inconsistent data or bad data. When you query your data and get unexpected results the problem typically is either the query or the data. Unfortunately, in today’s world of bringing so many vast data sources together each source of data doesn’t conform to one another. A common landing ground for the vast sources of data is Azure Synapse (formerly Azure data warehouse). The technique of marrying multiple sources together is a direct result of why data profiling and cleansing has increasingly become a heavier more intense role when implementing different legacy and modern day data analytics solutions. Luckily for us Microsoft has developed Azure data catalog and I will walk you through an implementation of profiling your Synapse database.
Prerequisites:
- You need to be either an Owner or Co-Owner on the Azure subscription
- Azure Active Directory needs to be configured
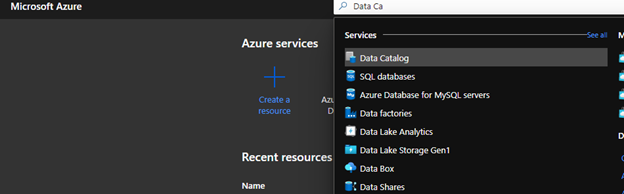
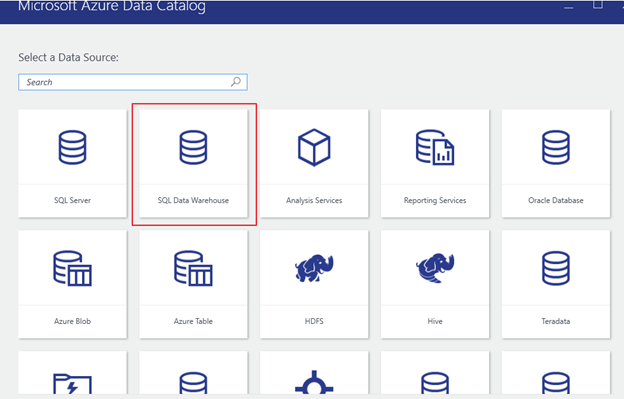
In the Azure portal under resources search for Azure Data Catalog
You have the option of choosing a free or standard pricing tier when completing the configuration. The limitation of the free tier is that you can only can register up to 5,000 assets. The standard pricing tier allows you to register 100,000 assets and supports Active Director users and groups authorization. For demo purposes, I am using the free pricing tier.
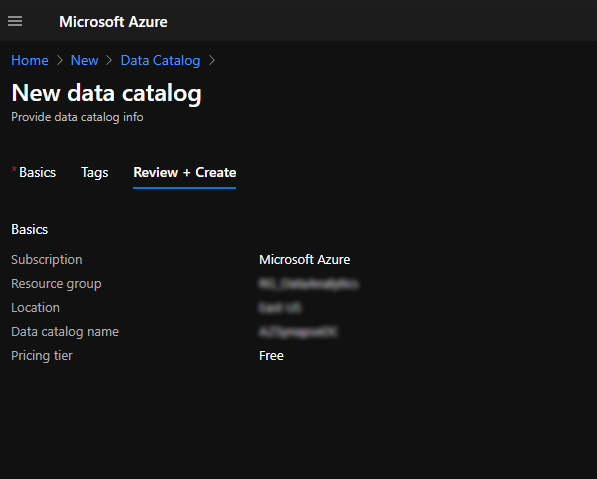
Once completed, click on create. On the backend, Azure will run a validation process.

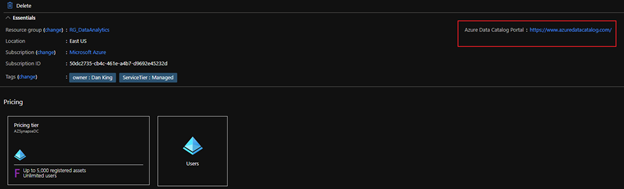
Next, navigate to the portal which is another Azure tool but separate from the azure portal just like Synapse Studios. On the resource page, there is a link that will redirect you to the portal.
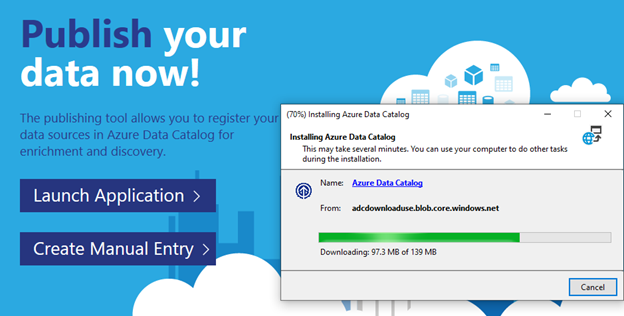
Once in the portal, you can now publish data. There are two options available. You can download an application to walk you through the configuration step by step or you can manually configure it. Some organizations will block you from downloading the executable in which you will need to manually configure your connection. The only issue I found with manually configuring your connection is the fact that you don’t currently get a connection test. Installing the application takes just a few minutes so I chose it for simplicity.
Once configured, for this exercise, we will use SQL Data Warehouse.
In the server name section, you want to enter your SQL dedicated endpoint.

Once connected, you will see your database and each schema that is available for you to review.
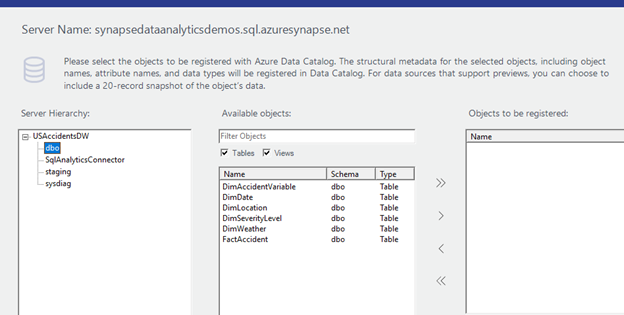
In this case I am only concerned about seeing my staging and dbo (database owner production tables) schema.
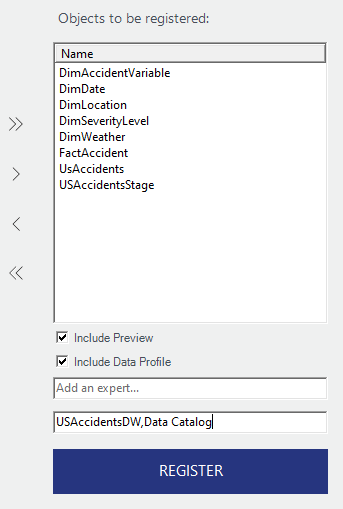
Note that above in the second box I added tags. They are comma separated to specify more than one. It is also a good practice to use tags here similar to how you would with other azure resources.
For this blog the area we want to focus on is highlighted below:
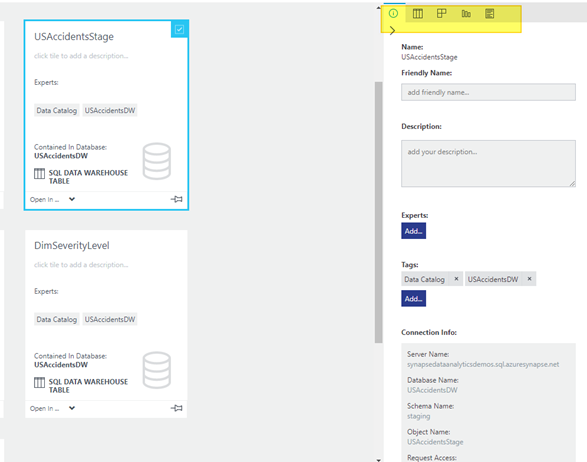
Defining the highlighted section in the above screen shot from left to right:
- Properties – Name, friendly name, table description etc.
- Preview – Preview your data
- Columns – Define your columns and data types
- Data Profile – Profiling your data to understand statistical stats on your data
- Documentation – Any documentation you want to manually note or document such as when and who made changes. Documenting why changes have been implemented.
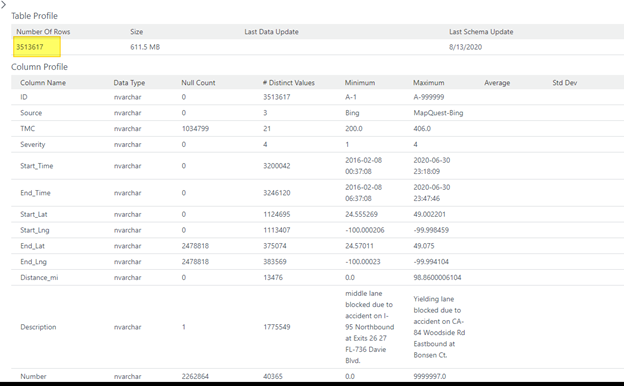
We are going to focus on a problem I found in my data. While developing some reports I noticed that I had bad location data. When I used a visualization to depict location information, my results showed blank values. This is not what I was expecting to see. Looking at my Stage table I had 3.5M rows. I expected to have counts on my SK_Location to render the same results. Just a sanity check I use when validating my data.
However, once my ELT process completed, my results are not exactly what I had expected. So, I ran a profile on my fact table.

Here is where data profiling offered invaluable information.
I profiled my fact table to get a high-level overview of how my data looks there. That opened my eyes to my ELT issue. I have 4k records with NULL surrogate keys in my fact table. For design purposes, I like to not have NULL values for SK’s. At this point based on the screen shot below I knew I had some additional cleansing to do.
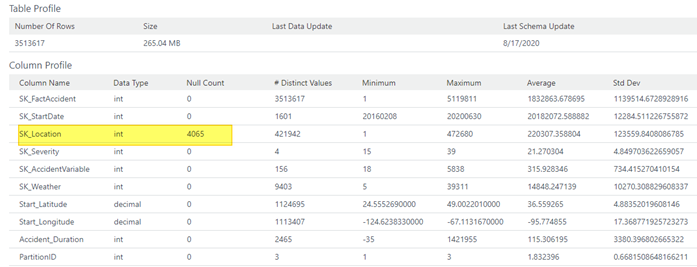
For an added architectural bonus take a look at the other statistics that’s provided. Particularly pay attention to distinct values column. If you were to profile a dimension the same way we did the fact table, clues may arise and reveal when a dimension may not be architected properly. Just imagine the power of using Azure Data Catalog!
So, in part one of the blog series, we walked through setting up the Azure data catalog to connect to Azure Synapse. We also looked at a use case of profiling your data to understand where additional data cleansing needs to occur. In part two I will walk you through a similar exercise of profiling data within Power BI.
Stay Tuned!