Calculated Columns Vs Measures
Optimizing Power BI
I have had the honor of developing a lot more solutions in Power BI over the past few years. Having a data analytics background in analysis services and data modeling has helped tremendously. I find myself always thinking about optimization and what’s best. The nice part about Power BI is behind the scene a tabular model is created. So now as a data modeler I can really relate!
Recently I have seen a lot of Power BI models where companies are not getting the speed and snappy interactive dash boarding capabilities that are expecting. So I take a preliminary look and realize they don’t know or understand what is happening on the backend. So I ask what made you create a measure instead of a column? Typically, the answer is “Because I needed a complex calculation that I can’t solve with a direct aggregation.” OK, I understand their reasoning but is it optimized and is it the best solution? My answer is “IT DEPENDS!”
I have seen so many times where measure are created by declaring a few variables and then using those variables to build an aggregated measure that has not been resolved with the underlining model. Let me make it clear that this blog is not to talk about how someone constructs their DAX statement but to provide an understanding of how calculated columns and measure both effect the performance of a model.
In order to understand when to use calculated columns or measures it’s also important to understand what we refer to as the formula engine and the storage engine. I won’t re-invent the wheel here. Marco Russo has a fantastic blog with downloadable files that breaks down the storage engine vs formula engine usage and it can be found here.
https://www.sqlbi.com/articles/optimizing-dax-expressions-involving-multiple-measures/
What I will say is I personally try to get the usage of the formula engine and storage engine down as much as possible. But typically I see a rise in one or the other. However, making a decision between the two can be simple. Calculated columns are prebuilt measures with little to no aggregations needed during a user initiated query request. This mean the architectural design around a calculated measure mainly takes up more RAM which is handled in the storage and increases the size of your PBIX file. A measure on the other hand is developed and built at runtime which means less RAM usage but a higher demand on CPU because each function and aggregation request is handled on the fly. So when you see that a query is taking a tremendous amount of time or lags you should understand where the time is spent to render and visually represent a given query.
let’s take a look at how to determine which queries are taking a lot of time. There are multiple ways to do this. Once again shout out to Marco Russo and his team for DAX Studio’s. DAX studios is a tool that you can use to analyze performance of queries as well as SSAS and Power BI models. However, I try to keep things as simple as possible. So I start up and load my PBIX in Power BI desktop. Click the view tab and get my performance analyzer up and running.
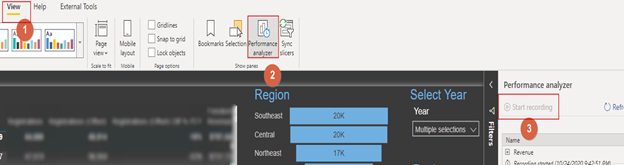
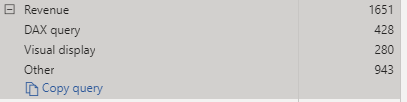
When I get my performance analyzer up and running I refresh my visuals and isolate where all of my time is being taken. In this case it looks like all of my time is take in a table to breakdown revenue and its actually the DAX query. Please See below:
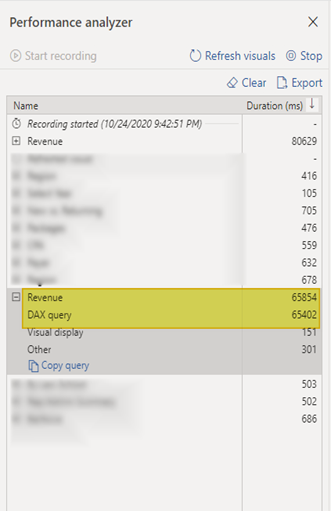
If you take a look you can now copy the query out. So copy the query and start up DAX studios. When you start up DAX studios make a connection to the PBIX. Once done you can past your query into the query analyzer window.
At the top of DAX studios, you have the option to turn on Server Timing:
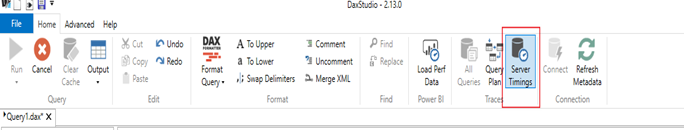
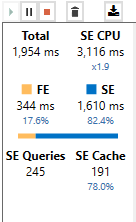
Turn this on and run your query in DAX studios. Let’s take a look at where time is being spent.
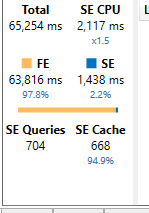
One visual is initiating 704 Queries to the storage engine and spending 64K milliseconds in the formula engine. Which means just to gather the requirements of the query and send it off to the storage engine its taking FOREVER. Obviously this is not ideal for a snappy visualization in Power BI.
So here is what I found. I found five variables that where derived directly in the calculation of my first measure and then used downstream in other measure to build aggregations. These variables had clear potential to be calculated columns. I switched each variable to a calculated column which effectively did increase the size of my PBIX and I also removed the daisy chained measures condensing them to one.
Let’s take a look at the results after clearing the cache.
The new query in DAX studios:
I am effectively issuing less queries from my storage engine spending less time in the formula engine and more time in the storage engine. Now my report renders in those Power BI lighting speeds.
Just to note there are times where you cannot make these type of adjustments. But knowing when and where to use calculated columns vs measures is a learned trait of a data modeler. These concepts translate from SSAS data modeling to Power BI modeling and can be a game changer when presenting optimized visualizations to the business. Stay tuned for more to come in the near future!
Great blog post, Dan. Keep them coming!